Debugging surprising behavior in SciPy numerical integration
I wrote a Python app to apply Bayes’ rule to continuous distributions. It looks like this:
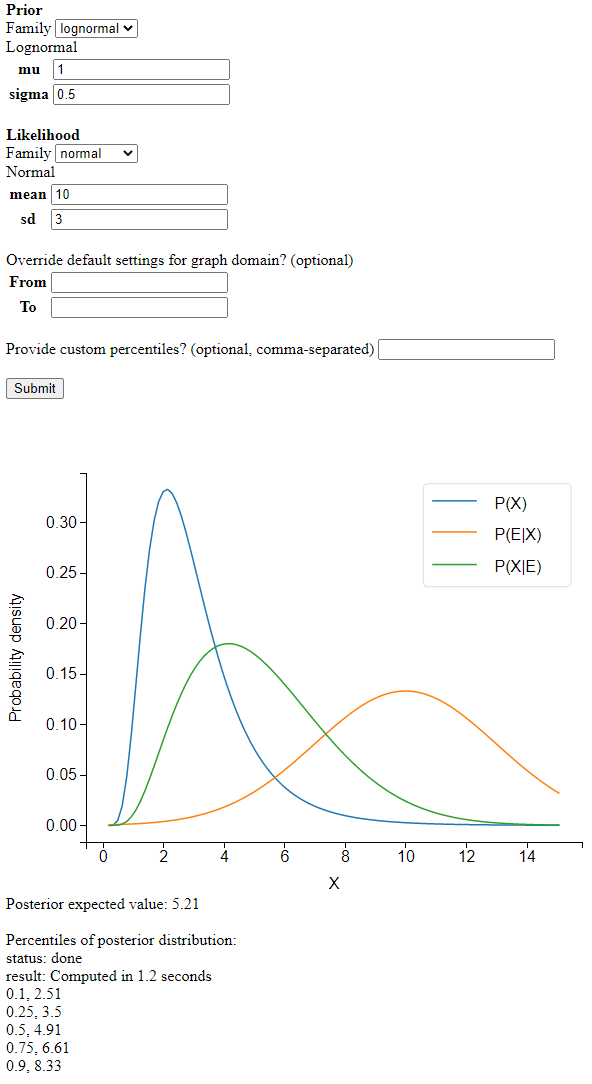
Screenshot
I’m learning a lot about numerical analysis from this project. The basic idea is simple:
def unnormalized_posterior_pdf(x):
    return prior.pdf(x)*likelihood.pdf(x)

# integrate unnormalized_posterior_pdf over the reals
normalization_constant = integrate.quad(unnormalized_posterior_pdf,-np.inf,np.inf)[0]

def posterior_pdf(x):
    return unnormalized_posterior_pdf(x)/normalization_constant
However, when testing my code on complicated distributions, I ran into some interesting puzzles.
A first set of problems was caused by the SciPy numerical integration routines that my program relies on. They were sometimes returning incorrect results or RuntimeErorrs. These problems appeared when the integration routines had to deal with ‘extreme’ values: small normalization constants or large inputs into the cdf function. I eventually learned to hold the integration algorithm’s hand a little bit and show it where to go.
A second set of challenges had to do with how long my program took to run: sometimes 30 seconds to return the percentiles of the posterior distribution. While 30 seconds might be acceptable for someone who desperately needed that bayesian update, I didn’t want my tool to feel like a punch card mainframe. I eventually managed to make the program more than 10 times faster. The tricks I used all followed the same strategy. In order to make it less expensive to repeatedly evaluate the posterior’s cdf by numerical integration, I tried to find ways to make the interval to integrate narrower.
You can follow along with all the tests described in this post using this file, whereas the code doing the calculations for the webapp is here.
Small normalization constants

When the prior and likelihood are far apart, the unnormalized posterior takes tiny values.
It turns out that SciPy’s integration routine, integrate.quad, (incidentally, written in actual Fortran!) has trouble integrating such a low-valued pdf.
prior = stats.lognorm(s=.5,scale=math.exp(.5)) # a lognormal(.5,.5) in SciPy notation
likelihood = stats.norm(20,1)

class Posterior_scipyrv(stats.rv_continuous):
    def __init__(self,d1,d2):
        super(Posterior_scipyrv, self).__init__()
        self.d1= d1
        self.d2= d2

        self.normalization_constant = integrate.quad(self.unnormalized_pdf,-np.inf,np.inf)[0]

    def unnormalized_pdf(self,x):
        return self.d1.pdf(x) * self.d2.pdf(x)

    def _pdf(self,x):
        return self.unnormalized_pdf(x)/self.normalization_constant

posterior = Posterior_scipyrv(prior,likelihood)

print('normalization constant:',posterior.normalization_constant)
print("CDF values:")
for i in range(30):
    print(i,posterior.cdf(i))
The cdf converges to… 52,477. This is not so good.
Because the cdf does converge, but to an incorrect value, we can conclude that the normalization constant is to blame. Because the cdf converges to a number greater than 1, posterior.normalization_constant, about 3e-12, is an underestimate of the true value.
If we shift the likelihood distribution just a little bit to the left, to likelihood = stats.norm(18,1), the cdf converges correctly, and we get a normalization constant of about 6e-07. Obviously, the normalization constant should not jump five orders of magnitude from 6e-07 to 3e-12 as a result of this small shift.
The program is not integrating the unnormalized pdf correctly.
Difficulties with integration usually have to do with the shape of the function. If your integrand zig-zags up and down a lot, the algorithm may miss some of the peaks. But here, the shape of the posterior is almost the same whether we use stats.norm(18,1) or stats.norm(20,1)1. So the problem really seems to occur once we are far enough in the tails of the prior that the unnormalized posterior pdf takes values below a certain absolute (rather than relative) threshold. I don’t yet understand why. Perhaps some of the values are becoming too small to be represented with standard floating point numbers.
This seems rather bizarre, but here’s a piece of evidence that really demonstrates that low absolute values are what’s tripping up the integration routine that calculates the normalization constant. We just multiply the unnormalized pdf by 10000 (which will cancel out once we normalize).
def unnormalized_pdf(self,x):
    return 10000*self.d1.pdf(x) * self.d2.pdf(x)
Now the cdf converges to 1 perfectly (??!).
Large inputs into cdf
We take a prior and likelihood that are unproblematically close together:
prior = stats.lognorm(s=.5,scale=math.exp(.5))# a lognormal(.5,.5) in SciPy notation
likelihood = stats.norm(5,1)
posterior = Posterior_scipyrv(prior,likelihood)

for i in range(100):
    print(i,posterior.cdf(i))
At first, the cdf goes to 1 as expected, but suddenly all hell breaks loose and the cdf decreases to some very tiny values:
22 1.0000000000031484
23 1.0000000000095246
24 1.0000000000031442
25 2.4520867144186445e-09
26 2.7186998869943613e-12
27 1.1495658559228458e-15
What’s going on? When asked to integrate the pdf from minus infinity up to some large value like 25, quad doesn’t know where to look for the probability mass. When the upper bound of the integral is in an area with still enough probability mass, like 23 or 24 in this example, quad finds its way to the mass. But if you ask it to find a peak very far away, it fails.
A piece of confirmatory evidence is that if we make the peak spikier and harder to find, by setting the likelihood’s standard deviation to 0.5 instead of 1, the cdf fails earlier:
22 1.000000000000232
23 2.9116983489798973e-12
We need to hold the integration algorithm’s hand and show it where on the real line the peak of the distribution is located. In SciPy’s quad, you can supply the points argument to point out places ‘where local difficulties of the integrand may occur’, but only when the integration interval is finite. The solution I came up with is to split the interval into two halves.
def split_integral(f,splitpoint,integrate_to):
    a,b = -np.inf,np.inf
    if integrate_to < splitpoint:
        # just return the integral normally
        return integrate.quad(f,a,integrate_to)[0]
    else:
        integral_left = integrate.quad(f, a, splitpoint)[0]
        integral_right = integrate.quad(f, splitpoint, integrate_to)[0]
        return integral_left + integral_right
This definitely won’t work for every difficult integral, but should help for many cases where most of the probability mass is not too far from the splitpoint.
For splitpoint, a simple choice is the average of the prior and likelihood’s expected values.
class Posterior_scipyrv(stats.rv_continuous):
    def __init__(self,d1,d2):
        self.splitpoint = (self.d1.expect()+self.d2.expect())/2
We can now override the built-in cdf method, and specify our own method that uses split_integral:
class Posterior_scipyrv(stats.rv_continuous):
    def _cdf(self,x):
        return split_integral(self.pdf,self.splitpoint,x)
Now things run correctly:
22 1.0000000000000198
23 1.0000000000000198
24 1.0000000000000198
25 1.00000000000002
26 1.0000000000000202
...
98 1.0000000000000198
99 1.0000000000000193
Defining support of posterior
So far I’ve only talked about problems that cause the program to return the wrong answer. This section is about a problem that only causes inefficiency, at least when it isn’t combined with other problems.
If you don’t specify the support of a continuous random variable in SciPy, it defaults to the entire real line. This leads to inefficiency when querying quantiles of the distribution. If I want to know the 50th percentile of my distribution, I call ppf(0.5). As I described previously, ppf works by numerically solving the equation . The ppf method automatically passes the support of the distribution into the equation solver and tells it to only look for solutions inside the support. When a distribution’s support is a subset of the reals, searching over the entire reals is inefficient.
To remedy this, we can define the support of the posterior as the intersection of the prior and likelihood’s support. For this we need a small function that calculates the intersection of two intervals.
def intersect_intervals(two_tuples):
    d1 , d2 = two_tuples

    d1_left,d1_right = d1[0],d1[1]
    d2_left,d2_right = d2[0],d2[1]

    if d1_right < d2_left or d2_right < d2_left:
        raise ValueError("the distributions have no overlap")

    intersect_left,intersect_right = max(d1_left,d2_left),min(d1_right,d2_right)

    return intersect_left,intersect_right
We can then call this function:
class Posterior_scipyrv(stats.rv_continuous):
    def __init__(self,d1,d2):
        super(Posterior_scipyrv, self).__init__()
        a1, b1 = d1.support()
        a2, b2 = d2.support()

        # 'a' and 'b' are scipy's names for the bounds of the support
        self.a , self.b = intersect_intervals([(a1,b1),(a2,b2)])
To test this, let’s use a beta distribution, which is defined on :
prior = stats.beta(1,1)
likelihood = stats.norm(1,3)
We know that the posterior will also be defined on . By defining the support of the posterior inside the the __init__ method of Posterior_scipyrv, we give SciPy access to this information.
We can time the resulting speedup in calculating posterior.ppf(0.99):
print("support:",posterior.support())
s = time.time()
print("result:",posterior.ppf(0.99))
e = time.time()
print(e-s,'seconds to evalute ppf')
support: (-inf, inf)
result: 0.9901821216897447
3.8804399967193604 seconds to evalute ppf

support: (0.0, 1.0)
result: 0.9901821216904315
0.40013647079467773 seconds to evalute ppf
We’re able to achieve an almost 10x speedup, with very meaningful impact on user experience. For less extreme quantiles, like posterior.ppf(0.5), I still get a 2x speedup.
The lack of properly defined support causes only inefficiency if we continue to use split_integral to calculate the cdf. But if we leave the cdf problem unaddressed, it can combine with the too-wide support to produce outright errors.
For example, suppose we use a beta distribution again for the prior, but we don’t use the split integral for the cdf, and nor do we define the support of the posterior as instead of .
prior = stats.beta(1,1)
likelihood = stats.norm(1,3)

class Posterior_scipyrv(stats.rv_continuous):
    def __init__(self,d1,d2):
        super(Posterior_scipyrv, self).__init__()
        self.d1= d1
        self.d2= d2

        self.normalization_constant = integrate.quad(self.unnormalized_pdf,-np.inf,np.inf)[0]

    def unnormalized_pdf(self,x):
        return self.d1.pdf(x) * self.d2.pdf(x)

    def _pdf(self,x):
        return self.unnormalized_pdf(x)/self.normalization_constant

posterior = Posterior_scipyrv(prior,likelihood)

print("cdf values:")
for i in range(20):
    print(i/5,posterior.cdf(i/5))
The cdf fails quickly now:
3.2 0.9999999999850296
3.4 0.0
3.6 0.0
When the integration algorithm is looking over all of , it has no way of knowing that all the probability mass is in . The posterior distribution has only one big bump in the middle, so it’s not surprising that the algorithm misses it.
If we now ask the equation solver in ppf to find quantiles, without telling it that all the solutions are in , it will try to evaluate points like cdf(4), which return 0 – but ppf is assuming that the cdf is increasing. This leads to catastrophe. Running posterior.ppf(0.5) gives a RuntimeError: Failed to converge after 100 iterations. At first I wondered why beta distributions would always give me RuntimeErrors…
Optimization: CDF memoization
When we call ppf, the equation solver calls cdf for the same distribution many times. This suggests we could optimize things further by storing known cdf values, and only doing the integration from the closest known value to the desired value. This will result in the same number of integration calls, but each will be over a smaller interval (except the first). This is a form of memoization.
We can also squeeze out some additional speedup by considering the cdf to be 1 forevermore once it reaches values close to 1.
class Posterior_scipyrv(stats.rv_continuous):
    def _cdf(self,x):
        # exploit considering the cdf to be 1
        # forevermore once it reaches values close to 1
        for x_lookup in self.cdf_lookup:
            if x_lookup < x and np.around(self.cdf_lookup[x_lookup],5)==1.0:
                return 1

        # check lookup table for largest integral already computed below x
        sortedkeys = sorted(self.cdf_lookup ,reverse=True)
        for key in sortedkeys:
            #find the greatest key less than x
            if key<x:
                ret = self.cdf_lookup[key]+integrate.quad(self.pdf,key,x)[0]
                self.cdf_lookup[float(x)] = ret
                return ret

        # Initial run
        ret = split_integral(self.pdf,self.splitpoint,x)
        self.cdf_lookup[float(x)] = ret
        return ret
If we return to our earlier prior and likelihood
prior = stats.lognorm(s=.5,scale=math.exp(.5)) # a lognormal(.5,.5) in SciPy notation
likelihood = stats.norm(5,1)
and make calls to ppf([0.1, 0.9, 0.25, 0.75, 0.5]), the memoization gives us about a 5x speedup:
memoization False
[2.63571613 5.18538207 3.21825988 4.56703016 3.88645864]
length of lookup table: 0
2.1609253883361816 seconds to evalute ppf

memoization True
[2.63571613 5.18538207 3.21825988 4.56703016 3.88645864]
length of lookup table: 50
0.4501194953918457 seconds to evalute ppf
These speed gains again occur over a range that makes quite a difference to user experience: going from multiple seconds to a fraction of a second.
Optimization: ppf with bounds
In my webapp, I give the user some standard percentiles: 0.1, 0.25, 0.5, 0.75, 0.9.
Given that ppf works by numerical equation solving on the cdf, if we give the solver a smaller domain in which to look for the solutions, it should find them more quickly. When we calculate multiple percentiles, each percentile we calculate helps us close in on the others. If the 0.1 percentile is 12, we have a lower bound of 12 for on any percentile . If we have already calculated a percentile on each side, we have both a lower and upper bound.
We can’t directly pass the bounds to ppf, so we have to wrap the method, which is found here in the source code. (To help us focus, I give a simplified presentation below that cuts out some code designed to deal with unbounded supports. The code below will not run correctly).
class Posterior_scipyrv(stats.rv_continuous):
    def ppf_with_bounds(self, q, leftbound, rightbound):
        left, right = self._get_support()

        # SciPy ppf code to deal with case where left or right are infinite.
        # Omitted for simplicity.

        if leftbound is not None:
          left = leftbound
        if rightbound is not None:
          right = rightbound


        # brentq is the equation solver (from Brent 1973)
        # _ppf_to_solve is simply cdf(x)-q, since brentq
        # finds points where a function equals 0
        return optimize.brentq(self._ppf_to_solve,left, right, args=q)
To get some bounds, we run the extreme percentiles first, narrowing in on the middle percentiles from both sides. For example in 0.1, 0.25, 0.5, 0.75, 0.9, we want to evaluate them in this order: 0.1, 0.9, 0.25, 0.75, 0.5. We store each of the answers in result.
class Posterior_scipyrv(stats.rv_continuous):
    def compute_percentiles(self, percentiles_list):
        result = {}
        percentiles_list.sort()

        # put percentiles in the order they should be computed
        percentiles_reordered = sum(zip(percentiles_list,reversed(percentiles_list)), ())[:len(percentiles_list)] # see https://stackoverflow.com/a/17436999/8010877

        def get_bounds(dict, p):
            # get bounds (if any) from already computed `result`s
            keys = list(dict.keys())
            keys.append(p)
            keys.sort()
            i = keys.index(p)
            if i != 0:
                leftbound = dict[keys[i - 1]]
            else:
                leftbound = None
            if i != len(keys) - 1:
                rightbound = dict[keys[i + 1]]
            else:
                rightbound = None
            return leftbound, rightbound

        for p in percentiles_reordered:
            leftbound , rightbound = get_bounds(result,p)
            res = self.ppf_with_bounds(p,leftbound,rightbound)
            result[p] = np.around(res,2)

        sorted_result = {key:value for key,value in sorted(result.items())}
        return sorted_result
The speedup is relatively minor when calculating just 5 percentiles.
Using ppf bounds? True
total time to compute percentiles: 3.1997928619384766 seconds

Using ppf bounds? False
total time to compute percentiles: 3.306936264038086 seconds
It grows a little bit with the number of percentiles, but calculating a large number of percentiles would just lead to information overload for the user.
This was surprising to me. Using the bounds dramatically cuts the width of the interval for equation solving, but leads to only a minor speedup. Using fulloutput=True in optimize.brentq, we can see the number of function evaluations that brentq uses. This lets us see that the number of evaluations needed by brentq is highly non-linear in the width of the interval. The solver gets quite close to the solution very quickly, so giving it a narrow interval hardly helps.
Using ppf bounds? True
brentq looked between 0.0 10.0 and took 11 iterations
brentq looked between 0.52 10.0 and took 13 iterations
brentq looked between 0.52 2.24 and took 8 iterations
brentq looked between 0.81 2.24 and took 9 iterations
brentq looked between 0.81 1.73 and took 7 iterations
total time to compute percentiles: 3.1997928619384766 seconds

Using ppf bounds? False
brentq looked between 0.0 10.0 and took 11 iterations
brentq looked between 0.0 10.0 and took 10 iterations
brentq looked between 0.0 10.0 and took 10 iterations
brentq looked between 0.0 10.0 and took 10 iterations
brentq looked between 0.0 10.0 and took 9 iterations
total time to compute percentiles: 3.306936264038086 seconds
Brent’s method is a very efficient equation solver.
-
It has a very similar shape to the likelihood (because the likelihood has much lower variance than the prior). ↩